We anticipate sluggish economic growth for the United States the next several years. Although robust growth does not appear to be on the horizon, we do not anticipate a recession in the immediate future, either. In the discussion below we develop a forecast of the US Economy through 2018.
Our evaluation begins with a Real Gross Domestic Product (Real GDP) forecast for the nation. We use this projection, in turn, to drive employment and unemployment forecasts for the United States.
Real Gross Domestic Product
Real GDP is a measure of economic output in constant dollars. Increases in Real GDP reflect growth in the economic base as well as increases in productivity.
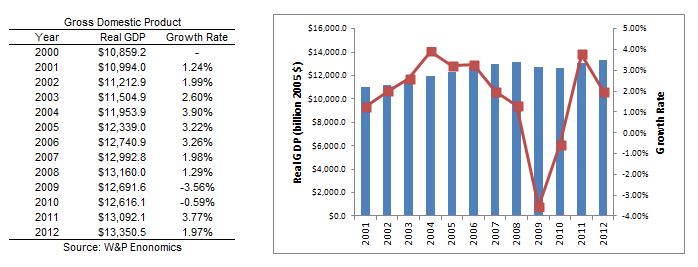
The table and graph below show Real GDP for the United States since 2000. The data set comes from the Bureau of Economic Analysis (BEA) via Woods & Pool Economics.
Real GDP grew from $10.859 trillion in 2000 to $13.160 trillion in 2008, before dropping 3.56% to $12.692 trillion in 2009. Real GDP dipped another 0.59% to $12.616 trillion in 2010. Since then Real GDP has grown to $13.351 trillion.
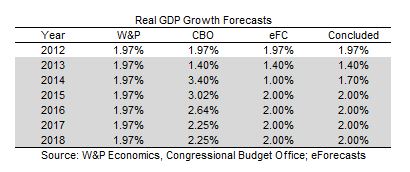
Forecasts for Real GDP growth vary. Woods & Poole Economics (W&P) projects 1.97% growth through 2018. The Congressional Budget Office (CBO) projects 1.40% growth in 2013, followed by 3.4% percent growth in 2014, dropping off to 2.25% growth in 2017. Finally, eForecasts (eFC) projects 1.40% growth in 2013, followed by 1.00% percent growth in 2014, increasing to 2.00% growth in 2015 as shown below.
The CBO has a history of underestimating the cost of government programs and overestimating tax revenues. Consequently, we discount their projection. W&P appears to overestimate the 2013 growth forecast, flat lining it thereafter. Consequently, we discount their projection. The eFC forecast is more conservative than the other two, but seems to reflect what we are seeing in the news. Taking all of this into consideration, we conclude 1.40% growth in 2013, followed by 1.70% percent growth in 2014, increasing to 2.00% growth in 2015 and thereafter. We refer to this as our “base projection” in the discussion that follows.
Establishment Employment
The Bureau of Labor Statistics (BLS) tracks employment two different ways: (1) Establishment Employment (sometimes referred to as At-Place Employment) which consists of a survey of employers in a specific geographic area, regardless of where the employees at the surveyed establishment actually live; and (2) Civilian Employment (sometimes referred to as Resident Employment) which consists of a survey of households in a specific geographic area, regardless of where the surveyed participants actually work. We begin our analysis with Establishment Employment.
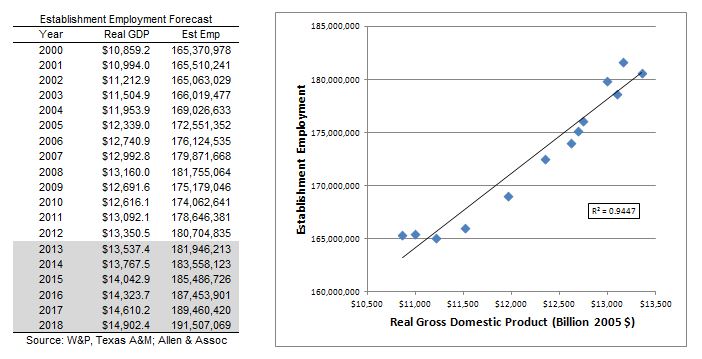
The table and graph below show Establishment Employment and Real GDP for the United States since 2000. The data set comes from the Bureau of Economic Analysis (BEA) and the Bureau of Labor Statistics (BLS) via Woods & Pool Economics.
Establishment Employment grew from 165.4 million in 2000 to 181.8 million in 2008, before dropping 3.62% to 175.2 million in 2009. Establishment Employment dipped another 0.62% to 174.1 million in 2010. Since then it has grown to 180.7 million.
The accompanying graph illustrates the relationship between Establishment Employment and Real GDP. The two measures are highly correlated; increases in Real GDP result in proportional increases in Establishment Employment. We used historic data to develop a statistical relationship between the two variables. Applying our base projection to Real GDP (discussed previously) and utilizing the statistical relationship between GDP and employment yielded our base projection for Establishment Employment. Our base projection shows Real GDP growing from $13.351 trillion in 2012 to $14.902 trillion in 2018, or 11.61 percent. This, in turn, will result in Establishment Employment growing from 180.7 million to 191.5 million, or 5.98 percent over this time period.
Employment by Industry
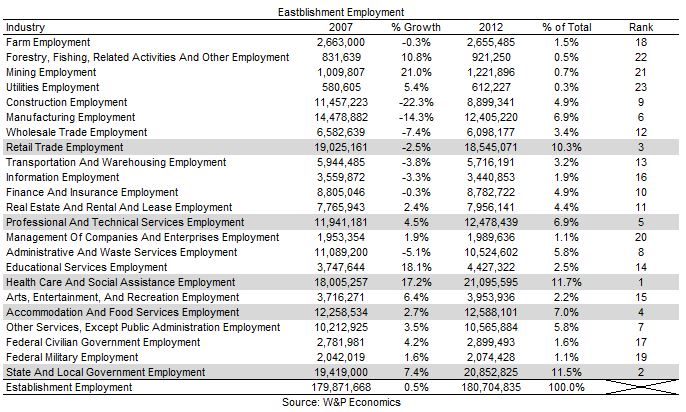
The Bureau of Labor Statistics (BLS) tracks Establishment Employment by major industry. In the table below we present the breakdown for 2000 and 2012. The data set comes from the Bureau of Labor Statistics (BLS) via Woods & Pool Economics.
The data suggests that Health Care and Social Assistance is the largest employment category, accounting for 11.7% of total US employment. State and Local Government is the second largest category, accounting for 11.5% of total employment. Retail Trade is the third largest category, accounting for 10.3% of total employment. Accommodation and Food Services is the fourth largest category, accounting for 7.0% of total employment. Professional and Technical Services is the fifth largest category, accounting for 6.9% of total employment.
The data also suggests that while Establishment Employment grew 0.5% between 2007 and 2012, Manufacturing Employment decreased 14.3% from 14.5 million to 12.4 million. This troubling trend has been underway for the past couple of decades and is driven by globalization as well as US corporate tax rates and regulations imposed on US manufacturers. This is a trend worth watching: Manufacturing Employment is the backbone of any nation’s economy.
Earnings by Industry
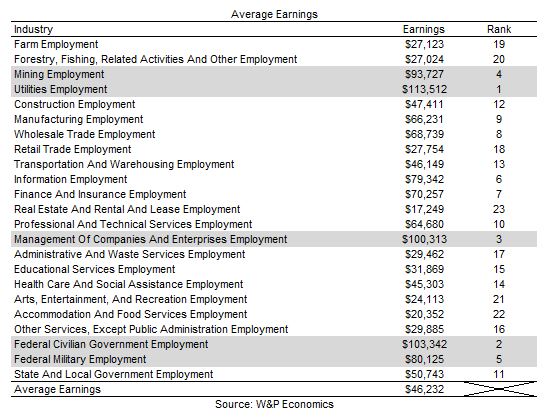
The Bureau of Labor Statistics (BLS) tracks Average Earnings by major industry. In the table below we present the breakdown for 2012. The data set comes from the Bureau of Labor Statistics (BLS) via Woods & Pool Economics.
The data suggests that Utilities is the highest paid industry, averaging $113,512 per employee. Federal Civilian Government is the second highest paid industry, averaging $103,342 per employee. Management is the third highest paid profession, averaging $100,313 per employee. Mining is the fourth highest paid industry, averaging $93,727 per employee. Federal Military is the fifth highest paid category, averaging $80,125 per employee. These figures are compared with US Average Earnings of $46,232 per employee.
Civilian Employment
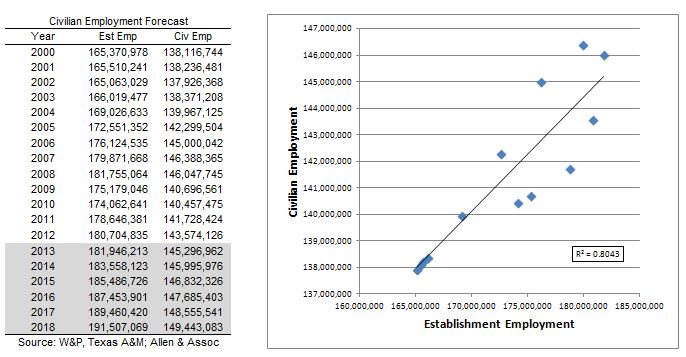
In this section we take a look at Civilian Employment. The table and graph below show Civilian Employment and Establishment Employment for the United States since 2000. The data set comes from the Bureau of Economic Analysis (BEA) and the Bureau of Labor Statistics (BLS) via Texas A&M Real Estate Center and Woods & Pool Economics.
Civilian Employment grew from 138.1 million in 2000 to 146.4 million in 2007, before dropping 3.89% to 140.7 million in 2009. Civilian Employment dipped another 0.14% to 140.5 million in 2010. Since then it has grown to 143.6 million.
The accompanying graph illustrates the relationship between Civilian Employment and Establishment Employment. The two measures are highly correlated; increases in Establishment Employment result in proportional increases in Civilian Employment. We used historic data to develop a statistical relationship between the two variables. Utilizing the statistical relationship between the two measures and our forecast for Establishment Employment yielded our base projection for Civilian Employment. Our base projection shows Establishment Employment growing from 180.7 million in 2012 to 191.5 million in 2018, or 5.98 percent. This, in turn, will result in Civilian Employment growing from 143.6 million to 149.4 million, or 4.04 percent over this time period.
Labor Force and Unemployment
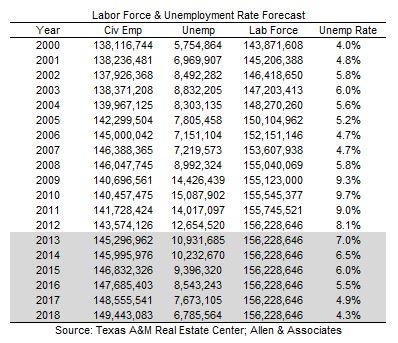
In this section we take a look at Labor Force and Unemployment. The table below shows Civilian Employment, Unemployment and Labor Force statistics for the United States since 2000. The data set comes from the Bureau of Labor Statistics (BLS) via Texas A&M Real Estate Center and Woods & Pool Economics.
Unemployment grew from 5.8 million in 2000 to 7.2 million in 2007 before increasing twofold to 14.4 million in 2009. Unemployment peaked at 15.1 million in 2010 before falling to 12.7 million in 2012. The Unemployment Rate grew from 4.0% in 2000 to 4.7% in 2007 before increasing to 9.3% in 2009. Unemployment peaked at 9.7% in 2010 before falling to 8.1% in 2012. The Labor Force grew from 143.9 million in 2000 to 155.0 million in 2008. Thereafter, it has remained relatively constant as unemployed and underemployed workers – frustrated with the difficult job market – have left the labor force. This is evidenced by the Labor Force Participation Rate (the percentage of the population in the labor force), which (according to Woods & Poole Economics) eroded from 51.0% in 2000 to 49.4% in 2012.
For projection purposes, we decreased Unemployment from year to year as Civilian Employment grew, holding Labor Force constant. Once the Unemployment Rate decreased to frictional levels (assumed to be 4.0%), we began to grow the Labor Force. Our base projection shows Civilian Employment growing from 143.6 million in 2012 to 149.4 million in 2018. This, in turn, will result in Unemployment decreasing from 12.7 million in 2012 to 6.8 million in 2018. The Labor Force will remain constant at 156.2 million, as the Unemployment Rate drops from 8.1% to 4.3% over this time period approaching frictional levels.
Conclusion
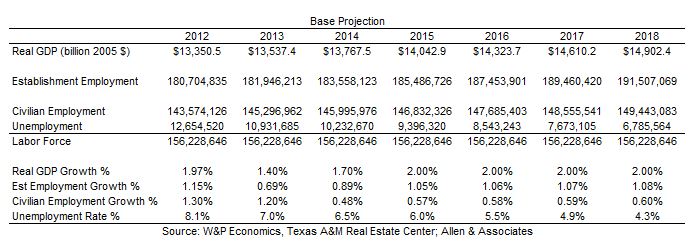
Our findings for the base projection are summarized below.
Our base projection assumes Real GDP growth of 1.4% in 2013, 1.7% in 2014 and 2.0% thereafter. Given this projection, we anticipate Establishment Employment to grow from 181.9 million in 2013 to 191.5 million in 2018. Over this same time period we anticipate Civilian Employment to grow from 145.3 million to 149.4 million. Finally, the base projection would result in an Unemployment Rate of 7.0% in 2013 decreasing to 4.3% in 2018. In other words, we anticipate modest economic growth for the next several years.
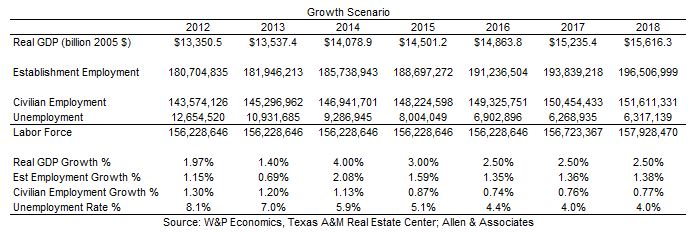
We also evaluated an optimistic growth scenario. Our findings are summarized below.
Our optimistic growth scenario assumes Real GDP growth of 1.4% in 2013, 4.0% in 2014, 3.0% in 2015, and 2.5% thereafter. Given this projection, we anticipate Establishment Employment to grow from 181.9 million in 2013 to 196.5 million in 2018. Over this same time period we anticipate Civilian Employment to grow from 145.3 million to 151.6 million. Finally, this projection would result in an Unemployment Rate of 7.0% in 2013 decreasing to 4.0% in 2017. In our opinion, the growth scenario is unlikely. Very few economists anticipate anything other than modest growth the next several years.
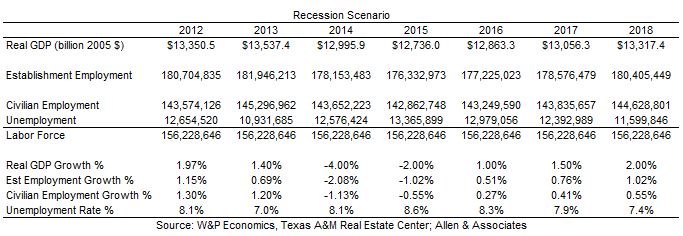
Finally, we evaluated a pessimistic recession scenario. Our findings are summarized below.
Our pessimistic recession scenario assumes Real GDP growth of 1.4% in 2013, -4.0% in 2014, -2.0% in 2015, 1.0% in 2016, 1.5% in 2017 and 2.0% in 2018. Given this projection, we anticipate Establishment Employment to decrease from 181.9 million in 2013 to 176.3 million in 2015, rebounding to 180.5 million in 2018. In addition, we anticipate Civilian Employment to decrease from 145.3 million in 2013 to 142.9 million in 2015, increasing to 144.6 million in 2018. Finally, the recession scenario would result in an Unemployment Rate of 7.0% in 2013, peaking at 8.6% in 2015 and decreasing to 7.4% in 2018.
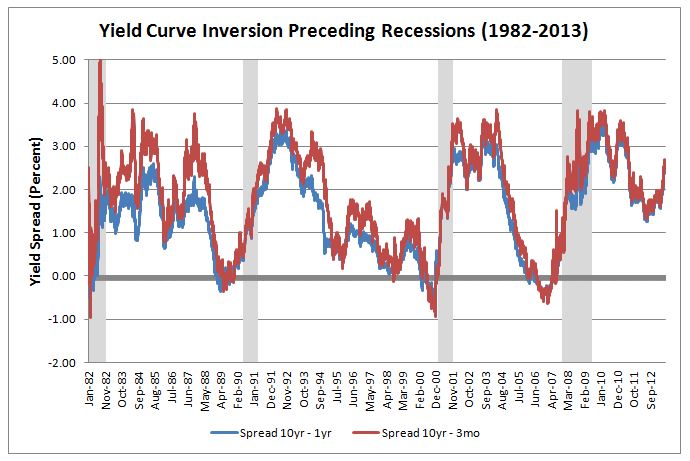
In our opinion, the recession scenario is unlikely. Recessions are almost always preceded by several months of an inverted yield curve (short term interest rates are higher than long term rates) as depicted in the graph below. Long term rates exceed short term rates by about 2.5% today. This suggests that we are not facing a recession in the immediate future. Although growth is slow now, an economic contraction does not appear to be on the horizon.
Feel free to contact me (Jeff Carroll) at 704-905-2276 with any questions you may have regarding this analysis.

