Top Development Sponsors in North Carolina

As we pointed out in a previous post, the 2013 North Carolina Housing Finance Agency (NCHFA) Qualified Allocation Plan (QAP) includes a requirement that all 9% tax credit deals include at least one principal who has successfully developed, operated and maintained at least one 9% tax credit project in the state of North Carolina. Such projects must have been placed in service between December 1, 2006 and January 1, 2012.

The following table presents the top sponsors of 9% tax credit deals in North Carolina. The table lists the sponsor’s name and the number of tax credit awards between 2006 and 2012:

Top Sponsors, NC, 2006-2012

It is important to note that the sponsors listed may have actually partnered with other entities on these projects.

Allen & Associates has worked with developers on over 300 projects in North Carolina since 2000. Our professional network includes relationships with principals meeting NCHFA’s experienced developer criteria. We can assist in putting together a successful development team for your project.

Feel free to contact me (Jeff Carroll) at 704-905-2276 with any questions you may have regarding your project.

Experienced Development Partner Requirement for North Carolina 9% Tax Credit Deals

The 2013 North Carolina Housing Finance Agency (NCHFA) Qualified Allocation Plan (QAP) includes a requirement that all 9% tax credit deals include at least one principal who has successfully developed, operated and maintained at least one 9% tax credit project in the state of North Carolina (see Section IV(D)(1) of the 2013 QAP). All such projects must have been placed in service between December 1, 2006 and January 1, 2012.

Deal Image

The experienced principal must be identified as the Applicant in the preliminary application. In addition, the principal must be either the general partner or the managing member of the ownership entity and remain responsible for overseeing the operation of the project for at least two years after it is placed in service. Five (5) application points will be awarded if the Applicant’s principal office is in North Carolina. The Agency reserves the right to determine whether a principal is, in fact, experienced as required by the QAP.

Allen & Associates has worked with developers on over 300 projects in North Carolina since 2000. Our professional network includes relationships with principals meeting NCHFA’s experienced developer criteria. We can assist in putting together a successful development team for your project.

Feel free to contact me (Jeff Carroll) at 704-905-2276 with any questions you may have regarding your project.

North Carolina Awards: Tax Credit Pricing

One of the most closely followed parameters in tax credit development is equity pricing. Although sometimes quoted as percent yield, equity pricing is usually expressed as the ratio of equity raised per dollar of tax credit over the 10-year compliance period for a project ($ Equity / $ Annual Tax Credit x 10). In the table below we present equity pricing for North Carolina projects awarded credits in 2012.

Equity Pricing, NC, 2012

For projects that received awards in 2012, the average equity pricing was $0.86. Age restricted (elderly) projects averaged $0.86, while general occupancy (family) came in at $0.86. New construction deals averaged $0.86, while rehabilitation deals came in at $0.85. There were no adaptive reuse projects in North Carolina’s 2012 allocation.

The graph below shows the distribution of awards.

Equity Pricing Graph, NC, 2012

The overwhelming majority of projects were priced at $0.86. A handful were priced as high as $0.88 with several coming in between $0.82 and $0.85.

Allen & Associates Consulting, Inc. specializes in development consulting for affordable housing. Feel free to contact me (Jeff Carroll) at 704-905-2276 with any questions you may have regarding your project.

North Carolina Awards: Land Cost per Unit

The next parameter we will consider is land cost per unit. All things being equal, projects with lower land costs per unit will be easier to finance. In the table below we present land cost per unit for projects awarded credits in 2012.

Land Cost per Unit, NC, 2012

For projects that received awards in 2012, the average land cost was $6,868 per unit. Age restricted (elderly) projects averaged $6,506 per unit, while general occupancy (family) came in at $7,049. New construction deals averaged $6,592 per unit, while the allocated land portion of total purchase price for rehabilitation deals came in at $8,011 per unit. There were no adaptive reuse projects in North Carolina’s 2012 allocation.

The graph below shows the distribution of awards.

Land Cost per Unit Graph, NC, 2012

The majority of projects were clustered between $5,000 and $10,000 per unit. Several exceeded this amount; several were lower than this amount. A few had virtually no basis in the land whatsoever (the land was contributed).

Allen & Associates Consulting, Inc. specializes in development consulting for affordable housing. Feel free to contact me (Jeff Carroll) at 704-905-2276 with any questions you may have regarding your project.

North Carolina Awards: Development Cost per Unit

Another important parameter for developers to consider is development cost per unit. All things being equal, projects with lower development costs per unit will require less tax credit. And as we saw in a previous post, tax credit per unit is an important tiebreaker criteria employed by the North Carolina Housing Finance Agency. In the table below we present development cost per unit for projects awarded credits in 2012.

Total Development Cost per Unit, NC, 2012

For projects that received awards in 2012, the average development cost was $121,667 per unit. Age restricted (elderly) projects averaged $121,796 per unit, while general occupancy (family) came in at $121,603. New construction deals averaged $122,455 per unit, while rehabilitation came in at $118,402. There were no adaptive reuse projects in North Carolina’s 2012 allocation.

The graph below shows the distribution of awards.

Toral Development Cost per Unit Graph, NC, 2012

The majority of projects were clustered between $110,000 and $130,000 per unit. Only a few exceeded this amount; a handful came in between $100,000 and $110,000. In order to be competitive, sponsors should attempt to keep their development costs below $130,000 per unit.

Allen & Associates Consulting, Inc. specializes in development consulting. Feel free to contact me (Jeff Carroll) at 704-905-2276 with any questions you may have regarding your project.

North Carolina Awards: Annual Tax Credit per Unit

The 9% tax credit application process is very competitive. Every point counts. Every dollar counts. That’s why seasoned developers look closely at parameters such as land cost per unit, total development cost per unit, annual tax credit per unit, tax credit equity per unit, and tax credit pricing ($ equity / $ tax credit) when putting together their proposals.

In North Carolina the #1 tiebreaker criteria is tax credit per unit. Projects with the least amount of federal credit per unit are given priority over competing projects, all other things being equal. In the table below we give the annual tax credit per unit for projects awarded credits in 2012.

Annual Tax Credit per Unit, NC, 2012

For the North Carolina projects that received awards in 2012, the average annual tax credit was $8,640 per unit. Age restricted (elderly) projects averaged $8,778 per unit, while general occupancy (family) came in at $8,570. New construction deals averaged $9,049 per unit, while rehabilitation came in at $6,942. There were no adaptive reuse projects in North Carolina’s 2012 allocation.

The graph below shows the distribution of awards.

Annual Tax Credit per Unit Graph, NC, 2012

The majority of awarded projects were clustered between $8,000-10,000 per unit. Only a few projects exceeded this amount. In order to be competitive, developers should attempt to keep their projects below $10,000 per unit in annual tax credits.

Allen & Associates Consulting, Inc. specializes in development consulting. Feel free to contact me (Jeff Carroll) at 704-905-2276 with any questions you may have regarding your tax credit development.

US Economic Outlook

We anticipate sluggish economic growth for the United States the next several years. Although robust growth does not appear to be on the horizon, we do not anticipate a recession in the immediate future, either. In the discussion below we develop a forecast of the US Economy through 2018.

Our evaluation begins with a Real Gross Domestic Product (Real GDP) forecast for the nation. We use this projection, in turn, to drive employment and unemployment forecasts for the United States.

Real Gross Domestic Product
Real GDP is a measure of economic output in constant dollars. Increases in Real GDP reflect growth in the economic base as well as increases in productivity.

The table and graph below show Real GDP for the United States since 2000. The data set comes from the Bureau of Economic Analysis (BEA) via Woods & Pool Economics.

Real GDP, 2013-07-30

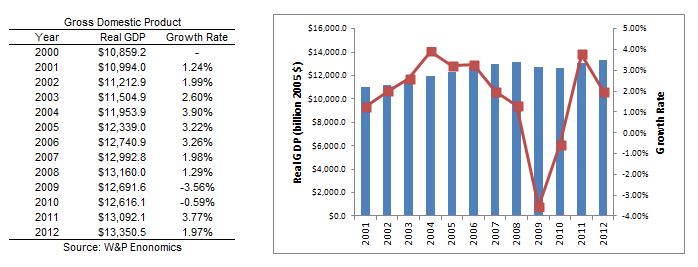
Real GDP grew from $10.859 trillion in 2000 to $13.160 trillion in 2008, before dropping 3.56% to $12.692 trillion in 2009. Real GDP dipped another 0.59% to $12.616 trillion in 2010. Since then Real GDP has grown to $13.351 trillion.

Forecasts for Real GDP growth vary. Woods & Poole Economics (W&P) projects 1.97% growth through 2018. The Congressional Budget Office (CBO) projects 1.40% growth in 2013, followed by 3.4% percent growth in 2014, dropping off to 2.25% growth in 2017. Finally, eForecasts (eFC) projects 1.40% growth in 2013, followed by 1.00% percent growth in 2014, increasing to 2.00% growth in 2015 as shown below.

Real GDP Forecasts, 2013-07-30

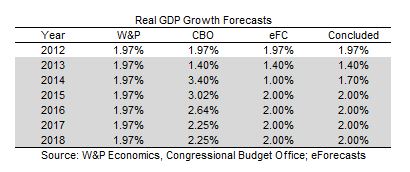
The CBO has a history of underestimating the cost of government programs and overestimating tax revenues. Consequently, we discount their projection. W&P appears to overestimate the 2013 growth forecast, flat lining it thereafter. Consequently, we discount their projection. The eFC forecast is more conservative than the other two, but seems to reflect what we are seeing in the news. Taking all of this into consideration, we conclude 1.40% growth in 2013, followed by 1.70% percent growth in 2014, increasing to 2.00% growth in 2015 and thereafter. We refer to this as our “base projection” in the discussion that follows.

Establishment Employment
The Bureau of Labor Statistics (BLS) tracks employment two different ways: (1) Establishment Employment (sometimes referred to as At-Place Employment) which consists of a survey of employers in a specific geographic area, regardless of where the employees at the surveyed establishment actually live; and (2) Civilian Employment (sometimes referred to as Resident Employment) which consists of a survey of households in a specific geographic area, regardless of where the surveyed participants actually work. We begin our analysis with Establishment Employment.

The table and graph below show Establishment Employment and Real GDP for the United States since 2000. The data set comes from the Bureau of Economic Analysis (BEA) and the Bureau of Labor Statistics (BLS) via Woods & Pool Economics.

Establishment Employment, 2013-07-30

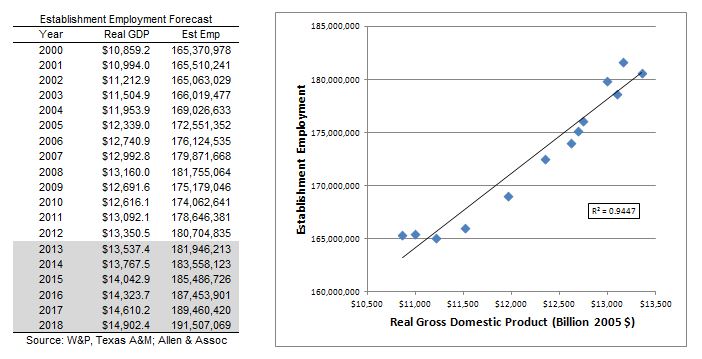
Establishment Employment grew from 165.4 million in 2000 to 181.8 million in 2008, before dropping 3.62% to 175.2 million in 2009. Establishment Employment dipped another 0.62% to 174.1 million in 2010. Since then it has grown to 180.7 million.

The accompanying graph illustrates the relationship between Establishment Employment and Real GDP. The two measures are highly correlated; increases in Real GDP result in proportional increases in Establishment Employment. We used historic data to develop a statistical relationship between the two variables. Applying our base projection to Real GDP (discussed previously) and utilizing the statistical relationship between GDP and employment yielded our base projection for Establishment Employment. Our base projection shows Real GDP growing from $13.351 trillion in 2012 to $14.902 trillion in 2018, or 11.61 percent. This, in turn, will result in Establishment Employment growing from 180.7 million to 191.5 million, or 5.98 percent over this time period.

Employment by Industry
The Bureau of Labor Statistics (BLS) tracks Establishment Employment by major industry. In the table below we present the breakdown for 2000 and 2012. The data set comes from the Bureau of Labor Statistics (BLS) via Woods & Pool Economics.

Employment by Industry, 2013-07-30

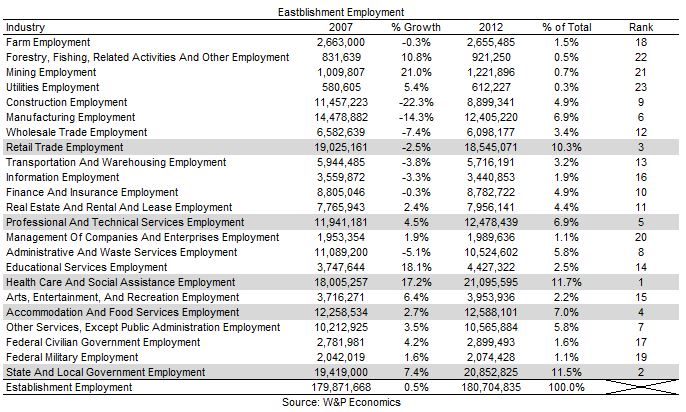
The data suggests that Health Care and Social Assistance is the largest employment category, accounting for 11.7% of total US employment. State and Local Government is the second largest category, accounting for 11.5% of total employment. Retail Trade is the third largest category, accounting for 10.3% of total employment. Accommodation and Food Services is the fourth largest category, accounting for 7.0% of total employment. Professional and Technical Services is the fifth largest category, accounting for 6.9% of total employment.

The data also suggests that while Establishment Employment grew 0.5% between 2007 and 2012, Manufacturing Employment decreased 14.3% from 14.5 million to 12.4 million. This troubling trend has been underway for the past couple of decades and is driven by globalization as well as US corporate tax rates and regulations imposed on US manufacturers. This is a trend worth watching: Manufacturing Employment is the backbone of any nation’s economy.

Earnings by Industry
The Bureau of Labor Statistics (BLS) tracks Average Earnings by major industry. In the table below we present the breakdown for 2012. The data set comes from the Bureau of Labor Statistics (BLS) via Woods & Pool Economics.

Earnings by Industry, 2013-07-30

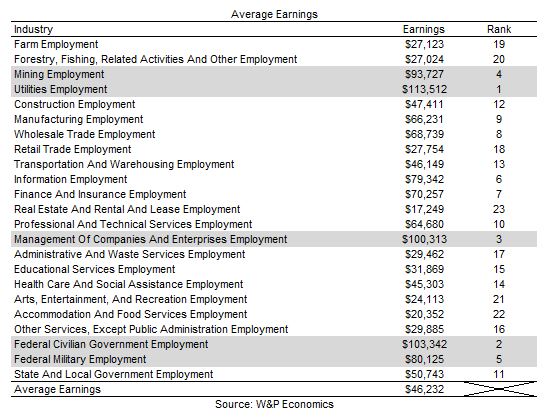
The data suggests that Utilities is the highest paid industry, averaging $113,512 per employee. Federal Civilian Government is the second highest paid industry, averaging $103,342 per employee. Management is the third highest paid profession, averaging $100,313 per employee. Mining is the fourth highest paid industry, averaging $93,727 per employee. Federal Military is the fifth highest paid category, averaging $80,125 per employee. These figures are compared with US Average Earnings of $46,232 per employee.

Civilian Employment
In this section we take a look at Civilian Employment. The table and graph below show Civilian Employment and Establishment Employment for the United States since 2000. The data set comes from the Bureau of Economic Analysis (BEA) and the Bureau of Labor Statistics (BLS) via Texas A&M Real Estate Center and Woods & Pool Economics.

Civilian Employment, 2013-07-30

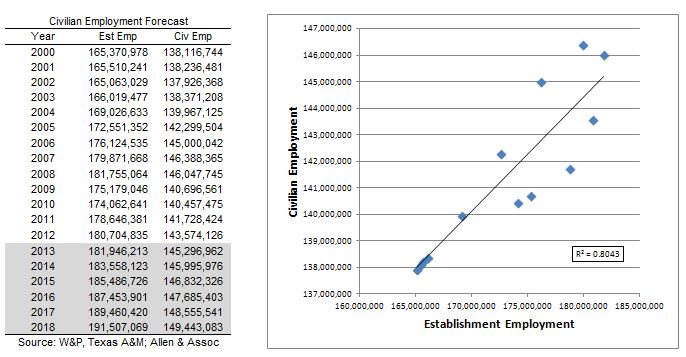
Civilian Employment grew from 138.1 million in 2000 to 146.4 million in 2007, before dropping 3.89% to 140.7 million in 2009. Civilian Employment dipped another 0.14% to 140.5 million in 2010. Since then it has grown to 143.6 million.

The accompanying graph illustrates the relationship between Civilian Employment and Establishment Employment. The two measures are highly correlated; increases in Establishment Employment result in proportional increases in Civilian Employment. We used historic data to develop a statistical relationship between the two variables. Utilizing the statistical relationship between the two measures and our forecast for Establishment Employment yielded our base projection for Civilian Employment. Our base projection shows Establishment Employment growing from 180.7 million in 2012 to 191.5 million in 2018, or 5.98 percent. This, in turn, will result in Civilian Employment growing from 143.6 million to 149.4 million, or 4.04 percent over this time period.

Labor Force and Unemployment
In this section we take a look at Labor Force and Unemployment. The table below shows Civilian Employment, Unemployment and Labor Force statistics for the United States since 2000. The data set comes from the Bureau of Labor Statistics (BLS) via Texas A&M Real Estate Center and Woods & Pool Economics.

Labor Force and Unemployment, 2013-07-30

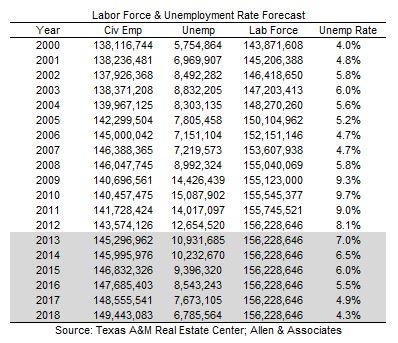
Unemployment grew from 5.8 million in 2000 to 7.2 million in 2007 before increasing twofold to 14.4 million in 2009. Unemployment peaked at 15.1 million in 2010 before falling to 12.7 million in 2012. The Unemployment Rate grew from 4.0% in 2000 to 4.7% in 2007 before increasing to 9.3% in 2009. Unemployment peaked at 9.7% in 2010 before falling to 8.1% in 2012. The Labor Force grew from 143.9 million in 2000 to 155.0 million in 2008. Thereafter, it has remained relatively constant as unemployed and underemployed workers – frustrated with the difficult job market – have left the labor force. This is evidenced by the Labor Force Participation Rate (the percentage of the population in the labor force), which (according to Woods & Poole Economics) eroded from 51.0% in 2000 to 49.4% in 2012.

For projection purposes, we decreased Unemployment from year to year as Civilian Employment grew, holding Labor Force constant. Once the Unemployment Rate decreased to frictional levels (assumed to be 4.0%), we began to grow the Labor Force. Our base projection shows Civilian Employment growing from 143.6 million in 2012 to 149.4 million in 2018. This, in turn, will result in Unemployment decreasing from 12.7 million in 2012 to 6.8 million in 2018. The Labor Force will remain constant at 156.2 million, as the Unemployment Rate drops from 8.1% to 4.3% over this time period approaching frictional levels.

Conclusion
Our findings for the base projection are summarized below.

Conclusion, Base Projection, 2013-07-30

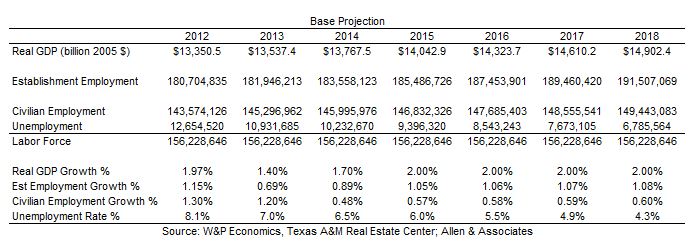
Our base projection assumes Real GDP growth of 1.4% in 2013, 1.7% in 2014 and 2.0% thereafter. Given this projection, we anticipate Establishment Employment to grow from 181.9 million in 2013 to 191.5 million in 2018. Over this same time period we anticipate Civilian Employment to grow from 145.3 million to 149.4 million. Finally, the base projection would result in an Unemployment Rate of 7.0% in 2013 decreasing to 4.3% in 2018. In other words, we anticipate modest economic growth for the next several years.

We also evaluated an optimistic growth scenario. Our findings are summarized below.

Conclusion, Growth Scenario, 2013-07-30

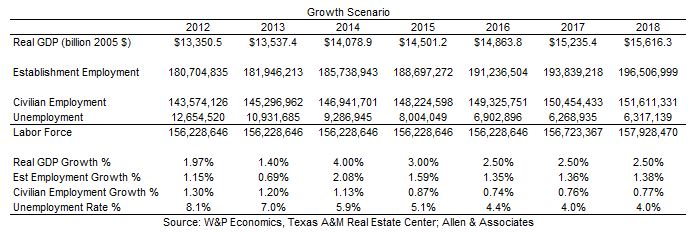
Our optimistic growth scenario assumes Real GDP growth of 1.4% in 2013, 4.0% in 2014, 3.0% in 2015, and 2.5% thereafter. Given this projection, we anticipate Establishment Employment to grow from 181.9 million in 2013 to 196.5 million in 2018. Over this same time period we anticipate Civilian Employment to grow from 145.3 million to 151.6 million. Finally, this projection would result in an Unemployment Rate of 7.0% in 2013 decreasing to 4.0% in 2017.  In our opinion, the growth scenario is unlikely. Very few economists anticipate anything other than modest growth the next several years.

Finally, we evaluated a pessimistic recession scenario. Our findings are summarized below.

Conclusion, Recession Scenario, 2013-07-30

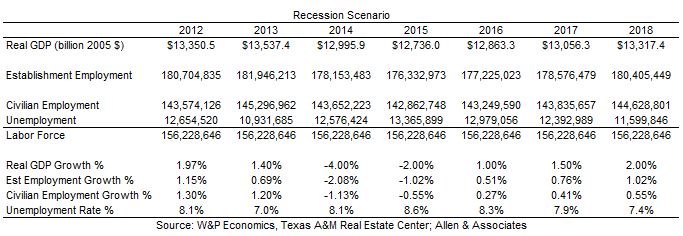
Our pessimistic recession scenario assumes Real GDP growth of 1.4% in 2013, -4.0% in 2014, -2.0% in 2015, 1.0% in 2016, 1.5% in 2017 and 2.0% in 2018. Given this projection, we anticipate Establishment Employment to decrease from 181.9 million in 2013 to 176.3 million in 2015, rebounding to 180.5 million in 2018. In addition, we anticipate Civilian Employment to decrease from 145.3 million in 2013 to 142.9 million in 2015, increasing to 144.6 million in 2018. Finally, the recession scenario would result in an Unemployment Rate of 7.0% in 2013, peaking at 8.6% in 2015 and decreasing to 7.4% in 2018.

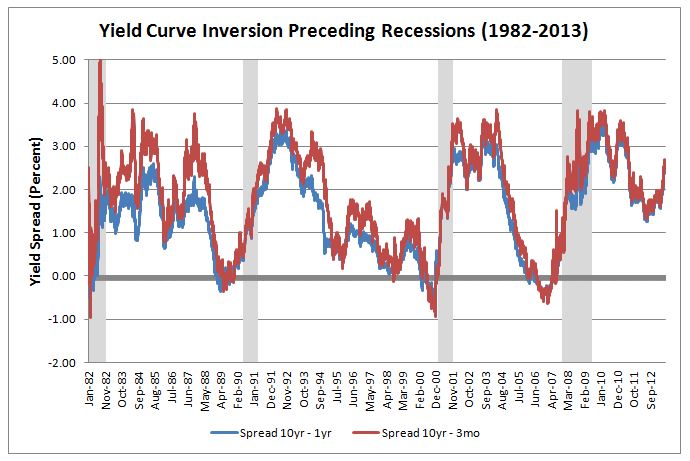
In our opinion, the recession scenario is unlikely. Recessions are almost always preceded by several months of an inverted yield curve (short term interest rates are higher than long term rates) as depicted in the graph below. Long term rates exceed short term rates by about 2.5% today. This suggests that we are not facing a recession in the immediate future. Although growth is slow now, an economic contraction does not appear to be on the horizon.

Yield Curve Inversion, 2013-07-31

Feel free to contact me (Jeff Carroll) at 704-905-2276 with any questions you may have regarding this analysis.

North Carolina’s Rental Production Program

North Carolina Housing Finance Agency’s Rental Production Program (RPP) makes loan funds available for qualifying affordable housing projects in the state. RPP funds come from a variety of state and federal programs: HOME funds (federal), HOME Match funds (state), North Carolina Housing Trust Funds (state).

NCHFA Logo

Projects receiving an allocation of tax credits are eligible for RPP loans. Projects requesting tax-exempt bonds are ineligible, however. All projects applying for RPP funds must submit a Notice of Real Property Acquisition with their preliminary tax credit application. Underwriting guidelines follow:

  1. At least 40% of the qualified units must be income restricted to at most 50% of AMI.
  2. RPP loans will have a 20-year term and a maximum interest rate of 2%. NCHFA may reduce the interest rate to ensure project feasibility at its discretion. Rural Development properties will be underwritten at the Rural Development-approved interest rates.
  3. Projects will be underwritten assuming a 7% vacancy rate. USDA-RD 515 properties will be underwritten at the Rural Development-approved vacancy rates.
  4. Projects requesting RPP funds will be underwritten assuming that rents will escalate at 2% per year and operating expenses will escalate at 3%. Replacement reserves will be trended at 4% however. Projects with HOME funds will be underwritten assuming that rents will escalate at 1.50% per year.
  5. New construction projects must budget a minimum of $3200 per unit per year in operating expenses (not including taxes, replacement reserves or resident support services). Rehabilitation and adaptive reuse projects must budget a minimum of $3400 per unit.
  6. New construction projects must budget $250 per unit in replacement reserves. Rehabilitation and adaptive reuse projects must budget a minimum of $350 per unit.
  7. RPP loans are cash flow loans. All projects must demonstrate an ability to repay at least a portion of the RPP loan. NCHFA will establish loan payments so that the project will maintain a debt coverage ratio (DCR) of 1.15. This may result in a large balloon payment due at maturity.

RPP loan funds sometimes require Davis-Bacon wages. Also, use of the funds sometimes reduces the qualified basis for tax credit projects. Developers should carefully weigh these facts when considering RPP funding.

Feel free to contact me (Jeff Carroll) at 704-905-2276 with any questions you may have regarding your tax credit development.

Income Targeting for Projects Claiming the North Carolina State Tax Credit

The North Carolina Housing Finance Agency (NCHFA) administers the state tax credit (STC) in conjunction with the North Carolina Department of Revenue (NCDOR). Projects with an award of 9% credits under the federal program are eligible for the STC. The state requires more restrictive income targeting for these projects, however (projects must comply with these limits for 30 years):

  1. If the project is in a High Income county: (a) 25% of the units must be affordable to households with incomes at or below 30% of Area Median Income (AMI), or (b) 50% of the units must be affordable to households with incomes at or below 40% of AMI.
  2. If the project is in a Moderate Income county: 50% of the units must be affordable to households with incomes at or below 50% of AMI.
  3. If the project is in a Low Income county: 40% of the units must be affordable to households with incomes at or below 50% of AMI.

The STC amount is equal to 10%, 20% or 30% of the development’s qualified basis (total development cost less non-depreciable costs and the cost to construct any market rate units). The STC percentage depends on the development’s location. High Income counties can claim a 10% STC; Moderate Income counties can claim 20%; Low Income counties can claim 30%. A chart showing which counties are considered high, moderate, or low income is found below:

Low-Middle-High Income Counties

Feel free to contact me (Jeff Carroll) at 704-905-2276 with any questions you may have regarding your tax credit financed property.

Income Targeting for North Carolina Low Income Housing Tax Credit Deals

Section 42 of the IRS Code defines a “qualified low-income housing project” as a residential rental project that meets one of the following two tests:

  1. 20-50 Test. Twenty percent or more of the residential units are both rent-restricted and occupied by individuals whose income is 50 percent or less of area median income (AMI)
  2. 40-60 Test. Forty percent or more of the residential units are both rent-restricted and occupied by individuals whose income is 60 percent or less of area median gross income (AMI)

The states, however, often provide point-scoring incentives through their Qualified Allocation Plans (QAPs) to achieve even lower rent and income targeting. The North Carolina Housing Finance Agency, for example, has established the following criteria in its QAP:

  1. If the project is in a High Income county: (a) Five points will be awarded if at least 25% of the units are affordable to and occupied by households with incomes at or below 30% of AMI, or (b) Two points will be awarded if at least 50% of the units are affordable to and occupied by households with incomes at or below 40% of AMI.
  2. If the project is in a Moderate Income county: (a) Five points will be awarded if at least 25% of the units are affordable to and occupied by households with incomes at or below 40% of AMI, or (b) Two points will be awarded if at least 50% of the units are affordable to and occupied by households with incomes at or below 50% of AMI.
  3. If the project is in a Low Income county: Five points will be awarded if at least 40% of the units are affordable to and occupied by households with incomes at or below 50% of AMI.

A chart showing which counties are considered high, moderate, or low income is found below:

Low-Middle-High Income Counties

The application process is very competitive. We regularly see developers opting for the deepest income targets in order to earn the most points for their development proposals.

Feel free to contact me (Jeff Carroll) at 704-905-2276 with any questions you may have regarding your tax credit financed property.